Polkadot Is In A Tight Range As A Drop Below The $6.00 Low Looms
Oct 09, 2022 at 13:15 //
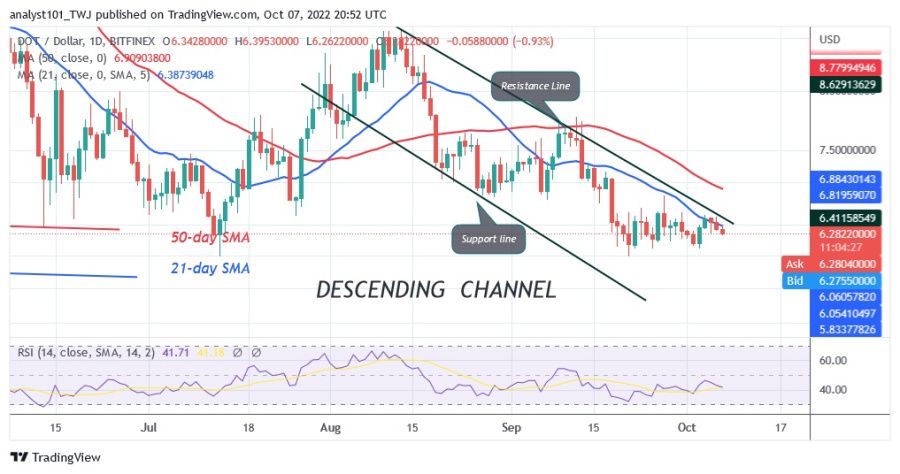
PriceThe price of Polkadot (DOT) is in a downtrend, but has resumed a sideways trend. The downtrend has eased after falling to the low of $5.98. The sideways movement starts when the cryptocurrency fluctuates between the price levels of $5.98 and $6.60.
Long-term analysis of the Polkadot price: bearish
The price of DOT will rise and retest the resistance at $6.00 or the 21-day line SMA. The upside moves are often rejected when the cryptocurrency falls back to the support at $6.00.
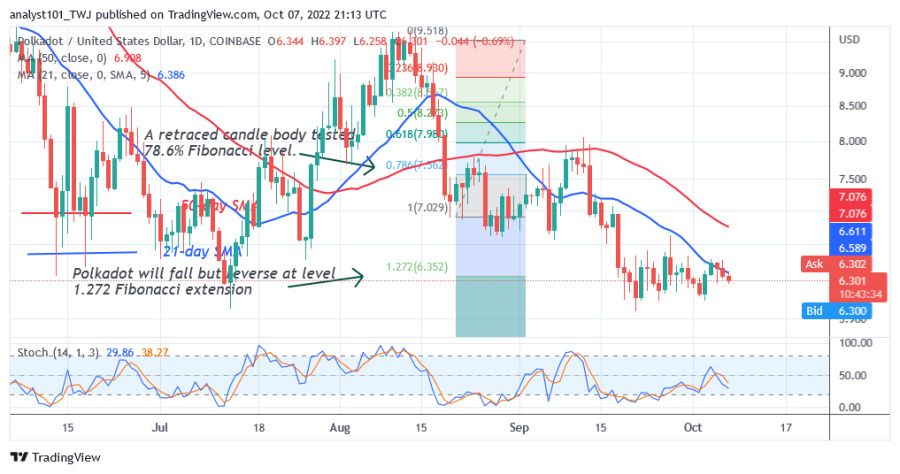
On October 4, buyers pushed the altcoin to the 21-day line SMA, but were rejected. This is the price trend since September 21. The uptrend will continue if the price rises again and breaks the 21-day line SMA. On the other hand, the price of DOT will fall to $4.00 if it loses the current support.
Analysis of the Polkadot indicator
The sideways movement has caused the Polkadot indicator for the period 14 to remain at the level 42 of the Relative Strength Index. Polkadot has continued to decline as the price bars are below the moving average lines. The market is declining as the altcoin is below the 50% range of the daily stochastic. This means that the altcoin is in a bearish momentum.

Technical Indicators
Key resistance zones: $10, $12, $14
Major support zones: $8.00, $6.00, $4.00
What is the next direction for Polkadot?
On September 21, Polkadot was trading between $6.00 and $6.60. The altcoin will develop when the price breaks the range. Today, Polkadot falls to the previous low at $5.98. The movement will continue if the price stays above the current support.

Disclaimer. This analysis and forecast are the personal opinions of the author and are not a recommendation to buy or sell cryptocurrency and should not be viewed as an endorsement by CoinIdol. Readers should do their research before investing in funds.
OhNoCryptocurrency via https://www.ohnocrypto.com/ @coinidol.com By Coin Idol, @Khareem Sudlow
