Weekly Cryptocurrency Analysis: Altcoins Are In A New Decline As Bears Overwhelm Bulls
Oct 10, 2022 at 09:23 //
PriceCryptocurrencies are still struggling with selling pressure at higher price levels.
On September 22, altcoins made an upward correction as buyers tried to keep the price above the moving average lines. This upward movement led to further selling pressure on cryptocurrencies. Let us take a look at the cryptocurrencies.
UNUS SED LEO
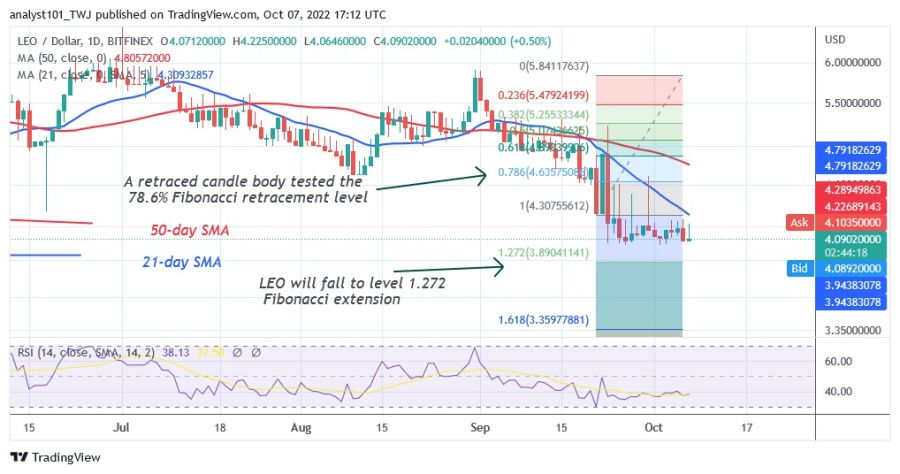
The price of UNUS SED LEO (LEO) is in a downtrend, falling to the low of $4.04. Selling pressure was triggered by the rejection of the resistance at $5.90. Since September 23, the cryptocurrency has consolidated above the $4.00 support. According to the price indicator, LEO will continue to fall.
During the downtrend on September 21, LEO made an upward correction and the candlestick tested the 78.6% Fibonacci retracement level. The correction suggests that LEO will fall to the 1.272 Fibonacci extension level or $3.89. The altcoin has declined significantly as it has reached the 38 level of the Relative Strength Index for the period 14.
LEO is trading and approaching the oversold region of the market. It is the lowest performing cryptocurrency asset and has the following characteristics:
Current Price: $4.11
Market capitalization: $4,022,015,362
Trading Volume: $2,970,689
7-Day Loss: 9.08%.
Helium
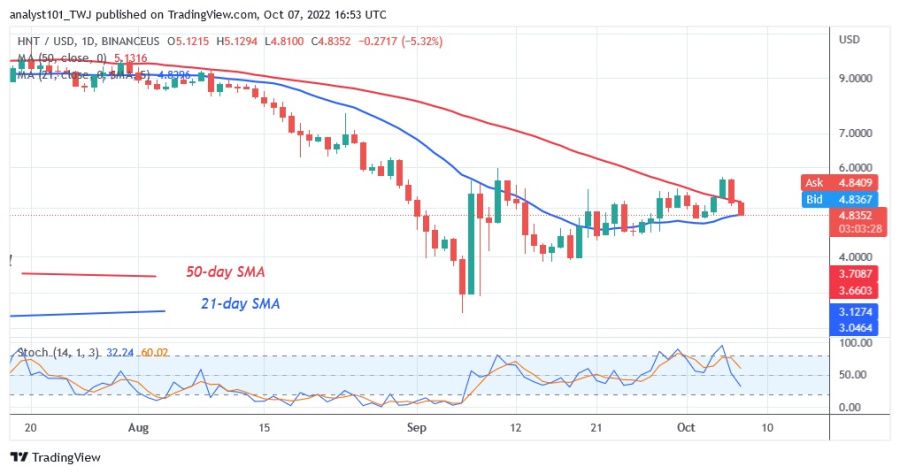
Helium (HNT) is in a downward correction as the price breaks above the moving average lines. Since September 6, selling pressure has eased after reaching the low of $3.10. The upward correction was slowed by resistance at $6.00. For this reason, HNT is in a sideways movement between the levels of $3.10 and $6.00. HNT will resume the upward trend and will reach again the previous high of $9.30 if the resistance at $6.00 is broken. On the other hand, a downtrend will start if the altcoin loses the $3.10 support. The altcoin is in a bearish momentum and below the 50% area of the daily stochastic.
It is the second worst performing cryptocurrency asset and has the following characteristics:
Current Price: $4.88
Market capitalization: $1,089,247,707
Trading Volume: $23,815,651
7-Day loss: 8.66%
Chiliz
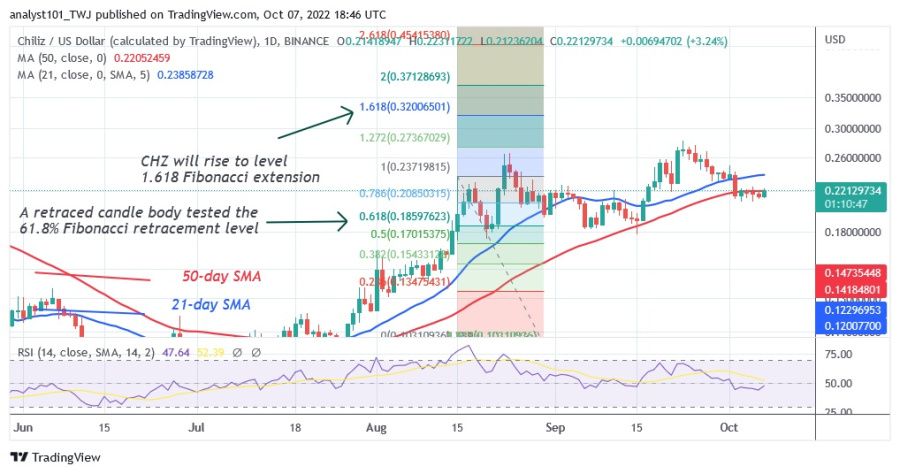
The price of Chiliz (CHZ) is in an uptrend and has risen to a high of $0.26. The cryptocurrency has recovered from the previous downtrend. The altcoin recovered after falling to a low of $0.080. On September 22, the altcoin reached a high of $0.27, but was rejected at the recent high. CHZ has retreated below the moving average lines. It is consolidating above the support of $0.21.
During the August 15 uptrend, CHZ retreated lower and the candlestick tested the 61.8% Fibonacci retracement level. The retracement suggests that CHZ will rise to the 1.618 Fibonacci Extension level or $0.32. Currently, the altcoin is below the 20% area of the daily stochastic. The market has reached the oversold area. Further selling pressure is unlikely.
It is the cryptocurrency asset with the third worst performance this week. It has the following characteristics:
Current price: $0.2201
Market capitalization: $1,956,240,768
Trading volume: $309,267,684
7-day loss: 6.49%.
Nexo
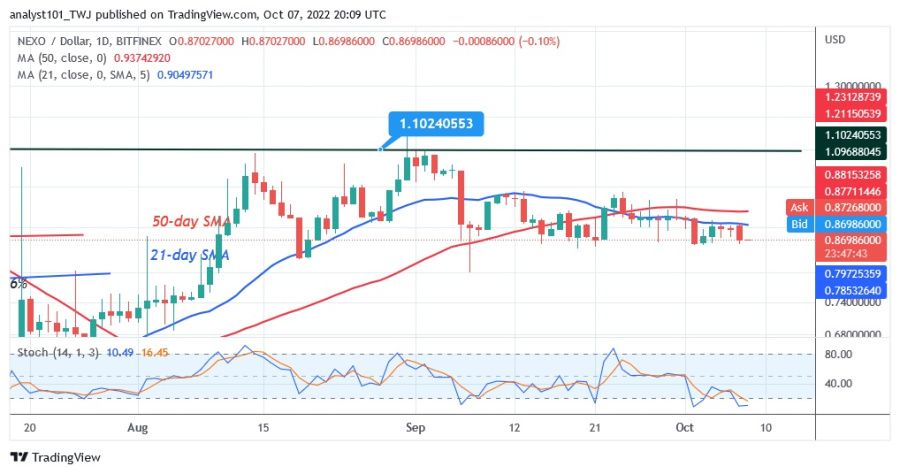
NEXO (NEXO) has recovered from the downtrend after falling to the low of $0.55. Today, NEXO has reached the high of $1.10, but the uptrend has stalled. The altcoin is now fluctuating below the overhead resistance. Buyers retested the overhead resistance twice but were rejected. The cryptocurrency has dropped to $0.89 below the moving average lines. NEXO is now trading in the oversold zone and below the 20% area of the daily stochastic. The market has reached bearish exhaustion.
NEXO is the fourth worst performing cryptocurrency with the following characteristics:
Current Price: $0.8735
Market capitalization: $873,499,475
Trading Volume: $4,949,272
7-Day loss: 6.16%.
Synthetix
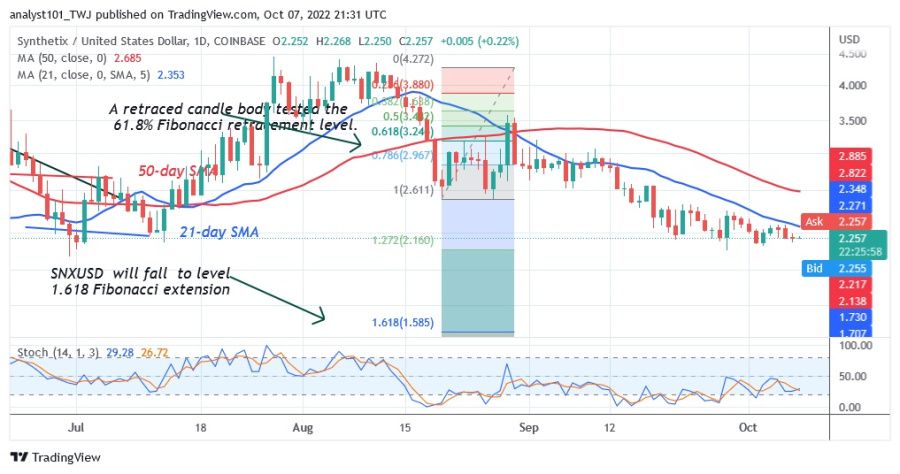
The price of Synthetix (SNX) has been in a downtrend since August 29. Buyers have tried to keep the price above the moving average line but have been rejected, and SNX has fallen further to the low of $2.24.
Meanwhile, on August 20, SNX corrected to the upside and a candlestick tested the 61.8% Fibonacci retracement level. The correction suggests that SNX will fall to the Fibonacci extension level of $1.618 or $1.58. The altcoin is in a bearish momentum below the 50% area of the daily stochastic.
Synthetic is the fifth worst cryptocurrency asset and has the following characteristics:
Current Price: $2.26
Market capitalization: $658,209,259
Trading Volume: $28,038,120
7-day loss: 6.15%
Disclaimer. This analysis and forecast are the personal opinions of the author and are not a recommendation to buy or sell cryptocurrency and should not be viewed as an endorsement by Coin Idol. Readers should do their own research before investing in funds.
OhNoCryptocurrency via https://www.ohnocrypto.com/ @coinidol.com By Coin Idol, @Khareem Sudlow
