Weekly Cryptocurrency Market Analysis: Altcoins Resume Fresh Decline to the Oversold Region as Bulls Buy the Dips
Oct 22, 2022 at 13:49 //
PriceCryptocurrencies are trading in the downtrend zone and have dropped significantly. Many of the cryptocurrencies have reached the oversold region of the market. Perhaps the altcoins are experiencing a respite as buyers are emerging.
Axie Infinity
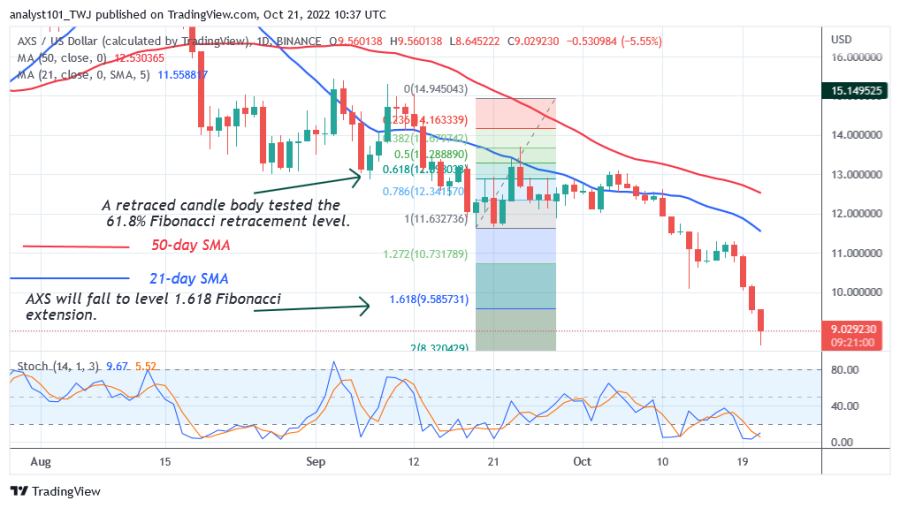
Axie Infinity (AXS) is in a downtrend, falling to the low of $9.04. The current decline came after an upward correction to the $20 high on July 30. Buyers could not sustain the bullish momentum above the recent high.
On August 13, the bulls retested the recent high and were rejected. On the downside, on September 19, AXS took an upside correction and a candlestick tested the 61.8% Fibonacci retracement level. The correction means that AXS will fall to the level of 1.618 Fibonacci extension or $9.58.
The cryptocurrency has fallen into the oversold zone of the market. Further downward price movement is unlikely. Axie Infinity has reached the oversold area of the market. The current downtrend has reached bearish exhaustion and is below the 20% area of the daily stochastic. AXS is the cryptocurrency with the lowest performance this week. It has the following characteristics:
Price: $9.07
Market capitalization: $2,459,205,858
Trading volume: $160,742,097
7-day loss: 19.58%
EthereumPoW
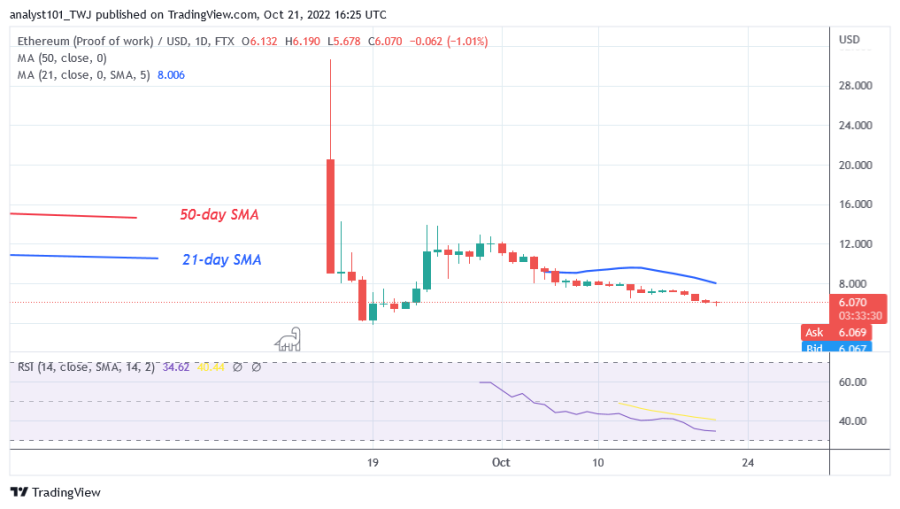
EthereumPoW (ETHW) is in a downtrend, falling to the low of $6.07. The cryptocurrency is approaching the previous low of $4.10. On September 15, the cryptocurrency reached its highest price of $30.67.
Today, the altcoin has dropped significantly to the low of $6.07. ETHW is approaching the oversold zone at level 35 of the Relative Strength Index for period 14. The altcoin is in the downtrend zone and may continue to decline. The altcoin is the second worst performing cryptocurrency this week. The cryptocurrency has the following characteristics:
Price: $6.11
Market capitalization: $653,049,748
Trading volume: $54,739,833
7-day loss: 18.45%
Ethereum Name Service
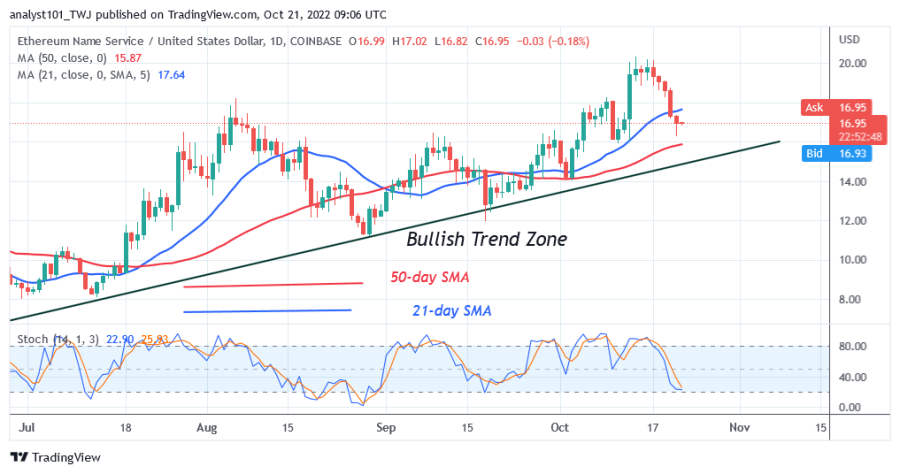
Ethereum Name Service (ENS) is in an uptrend, but buyers are challenging resistance at $18.00. The initial uptrend was interrupted on August 6, when it turned sideways again. On October 13, the bulls broke through the resistance and reached the high of $20. The altcoin has fallen below the $18 high. It also fell below the 21-day line SMA.
As a result, ENS will be forced to move between the moving average lines. The altcoin will resume its trend when the moving average lines are broken. ENS is in a bearish momentum but below the 40% area of the daily stochastic. ENS is the cryptocurrency with the third worst performance this week. It has the following characteristics:
Price: $16.94
Market capitalization: $1,687,861,238
Trading volume: $65,083,375
7-day loss: 13.45%
Compound
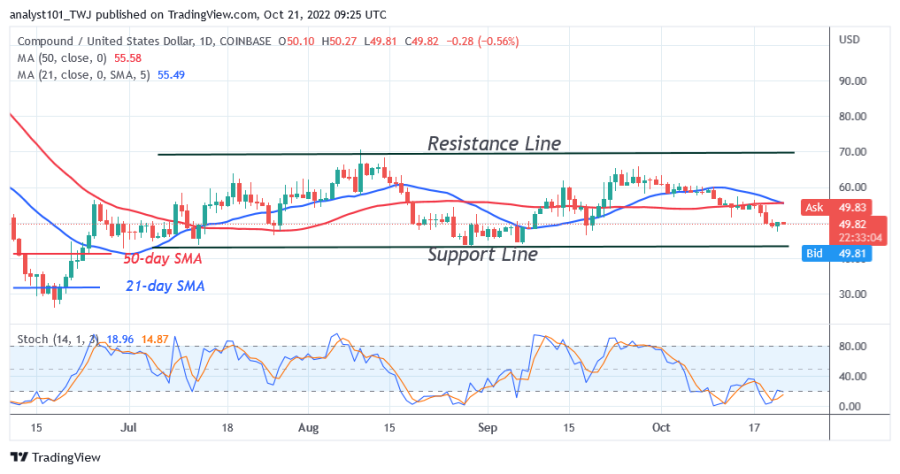
Compound (COMP) has been in a sideways trend since June. The altcoin fluctuates between $45 and $70 price levels. The presence of doji candlesticks is responsible for the range-bound movement. The indecisive candles with small bodies indicate that buyers and sellers are undecided about the direction of the market. The altcoin is trading at $49.15 at the time of writing. The coin has reached the oversold area and is below the 20% area of the daily stochastic. It is the cryptocurrency asset with the fourth worst performance this week. It has the following characteristics:
Price: $49.86
Market capitalization: $500,504,050
Trading volume: $24,724,943
7-day loss: 11.95%
The Graph
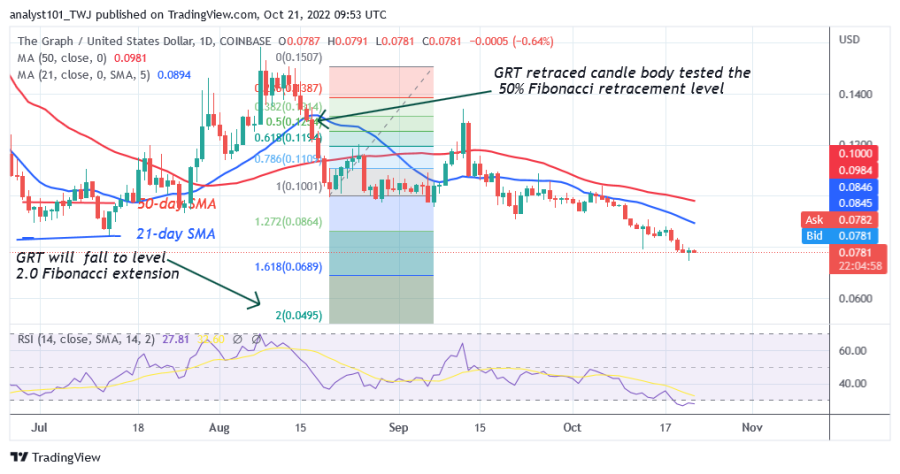
The Graph (GRT) is in a downtrend but has resumed a new decline. The selling pressure was triggered by the failed upward correction on September 12. The altcoin was pushed off at the $0.14 resistance zone when the price fell below the moving average lines.
At the August 19 downtrend, GRT took an upward correction and a candlestick tested the 50% Fibonacci retracement level. The corrections suggest that the coin will fall to the 2.0 Fibonacci extension level or $0.0495. The Graph has dropped significantly as it has reached the oversold area. The altcoin is the fifth worst cryptocurrency and has the following characteristics:
Price: $0.07827
Market capitalization: $788,590,001
Trading volume: $18,242,032
7-day loss: 11.21%
Disclaimer. This analysis and forecast are the personal opinions of the author and are not a recommendation to buy or sell cryptocurrency and should not be viewed as an endorsement by CoinIdol. Readers should do their own research before investing.
OhNoCryptocurrency via https://www.ohnocrypto.com/ @coinidol.com By Coin Idol, @Khareem Sudlow
