Bitcoin Faces Strong Resistance When It Falls Below $18K
Dec 15, 2022 at 12:18 //
PriceThe price of Bitcoin (BTC) has started to trade in the bullish trend zone.
Bitcoin price long-term forecast: bullish
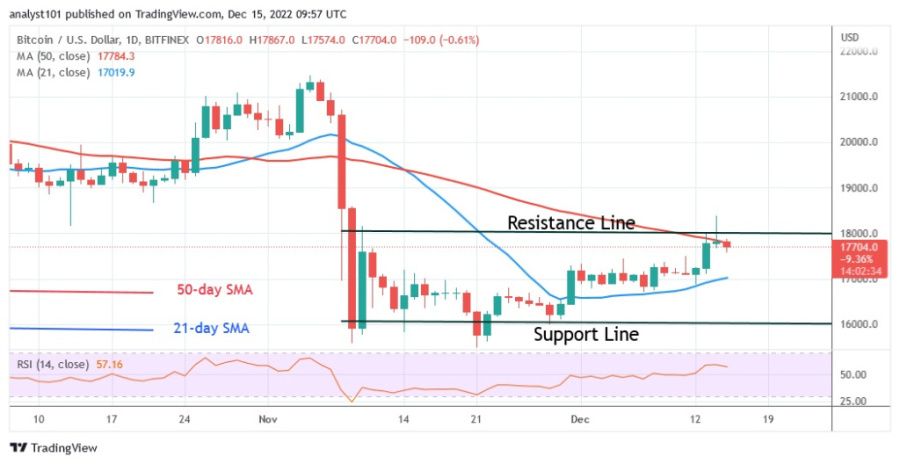
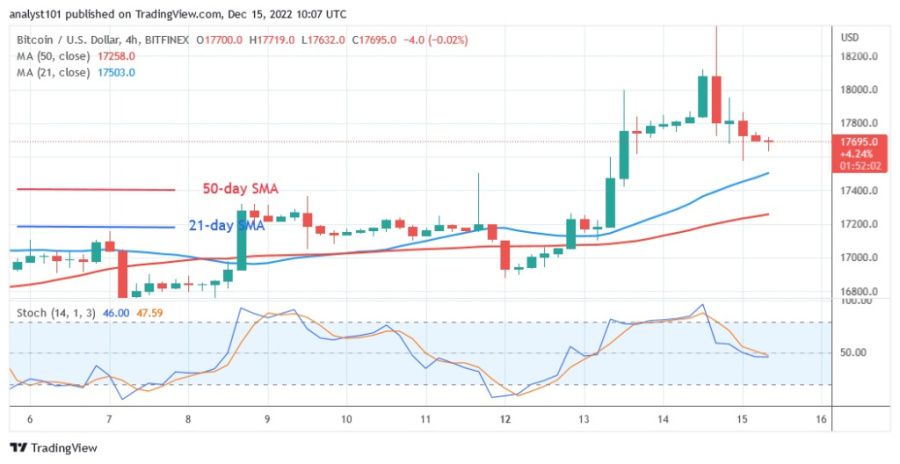
However, the price recovery was short-lived as buyers only managed to keep the price above the 50-day line SMA yesterday. The price of BTC exceeded both the barrier at $18,156 and the 50-day line SMA. When it approached the high of $18,391, the upward momentum was stopped. This indicates that the $18,156 resistance level is guarded by the bears. Bitcoin will retest its previous highs at $20,000 and $21,500 if the positive trend continues as predicted. Bitcoin price has slipped between the moving averages lines today, moving back in a range for the past few days. The largest cryptocurrency is expected to dive down above the $17,000 support or the 21-day line SMA.
Bitcoin indicator display
The Relative Strength Index is at level 56, Bitcoin is in an uptrend due to the recent price recovery. Once the Bitcoin price dips between the moving average lines, the current rangebound movement begins. The largest cryptocurrency is currently moving below the 50 level of the stochastic on the daily chart.

Technical indicators
Key resistance levels - $30,000 and $35,000
Key support levels - $20,000 and $15,000
What is the next direction for BTC/USD?
Bitcoin (BTC) has started the resumption of a sideways movement. Due to the strong resistance at the recent high, buyers could not benefit from the recent price recovery. The BTC price will continue to fluctuate in a narrow range between $15,588 and $18,156.

Disclaimer. This analysis and forecast are the personal opinions of the author and are not a recommendation to buy or sell cryptocurrency and should not be viewed as an endorsement by CoinIdol. Readers should do their research before investing in funds.
OhNoCryptocurrency via https://www.ohnocrypto.com/ @coinidol.com By Coin Idol, @Khareem Sudlow
