Bitcoin Stabilizes Above $16,550, But Threatens Further Decline
Dec 19, 2022 at 11:55 //
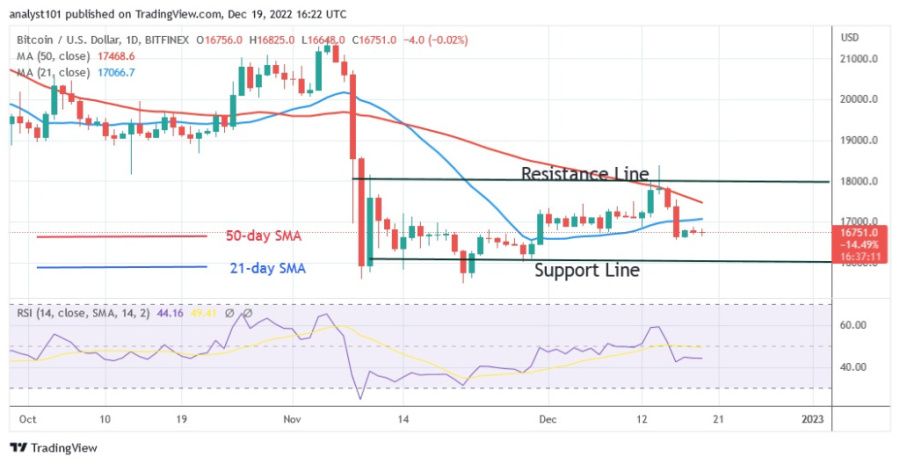
PriceAfter a recent dip, Bitcoin (BTC) price has consolidated above the support level of $16,550.
Bitcoin price long term forecast: bullish
The current decline is due to buyers being unable to sustain the positive momentum that saw Bitcoin reach a high of $18,391. Buyers broke through the 50-day line SMA and resistance at $18,000, but were unable to sustain upward momentum. Recent high selling pressure has rendered the bullish situation worthless. Selling pressure eased on Dec. 16 as buyers kept the price above the $16,550 support level
The cryptocurrency value has stabilized above the existing support for a probable reversal in the last 48 hours. The bitcoin price fell into oversold territory on December 16. In the oversold area, buyers emerge and drive prices higher. On the downside, selling pressure will resume when bears break the existing support. Bitcoin will fall and retest its previous lows of $16,000 and $15,588 respectively.
Bitcoin indicator display
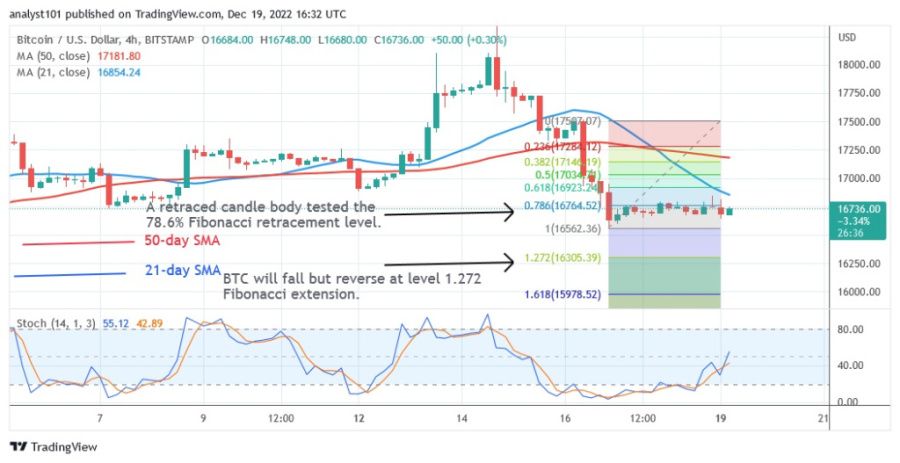
The Relative Strength Index is currently at 43 and the current decline has pushed Bitcoin into the bearish trend zone, signaling that it will continue to fall. The price bars are below the moving average lines, indicating that the price will continue to fall. The largest cryptocurrency is oversold and trading below the 20 level of the daily stochastic. However, after the price decline, BTC is now in a bullish momentum above the daily stochastic mark of 40.

Technical indicators
Key resistance levels - $30,000 and $35,000
Key support levels - $20,000 and $15,000
What is the next direction for BTC/USD?
Bitcoin (BTC) is trading sideways above its current support. The Fibonacci technique has predicted a further decline and reversal. On December 16, the downtrend was reversed and the candlestick tested the 78.6% Fibonacci retracement line. The correction suggests that BTC will fall but then reverse at the 1,272 Fibonacci extension or $16,305.39.

Disclaimer. This analysis and forecast are the personal opinions of the author and are not a recommendation to buy or sell cryptocurrency and should not be viewed as an endorsement by CoinIdol. Readers should do their research before investing in funds.
OhNoCryptocurrency via https://www.ohnocrypto.com/ @coinidol.com By Coin Idol, @Khareem Sudlow
