Ripple Rises Again, But Cannot Hold Above $0.40
Dec 02, 2022 at 13:44 //
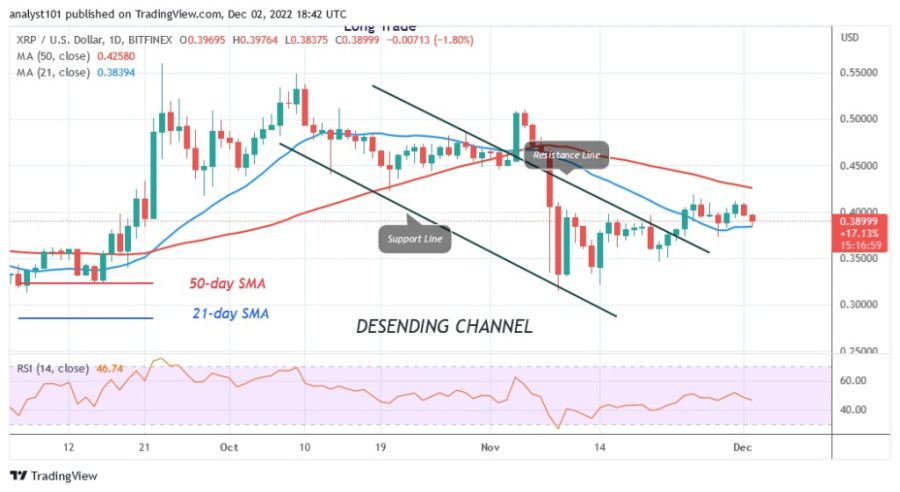
PriceThe Ripple (XRP) price is stuck between the moving average lines after the recent upward correction. The 50-day line SMA was not broken by the positive momentum.
Ripple price long-term forecasts: bearish
The moving average lines have contained the price of XRP over the past week. Resistance at $0.40 was a challenge for the cryptocurrency's price. Ripple will perform if the moving average lines are crossed. XRP will depreciate negatively if the price falls below the 21-day line SMA. The altcoin will then fall back to $0.31. Similarly, the value of XRP will rise to its previous high of $0.55 if buyers keep the price above the 50-day line SMA. At the time of writing, the XRP/USD price is at $0.39.
Ripple indicator analysis
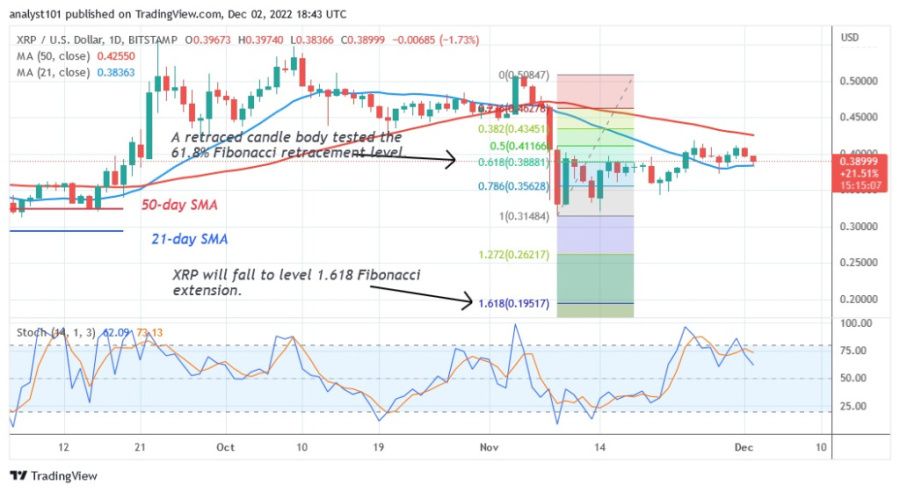
Ripple is at level 46 on the Relative Strength Index for the 14 period. Ripple is again under selling pressure in the downtrend area. The fact that XRP is capped between the moving average lines indicates a sideways movement. The SMAs of the 50-day line and the 21-day line show that the negative trend continues. The stochastic on the daily chart shows that XRP is moving in a bearish direction below the 80 level.

Technical Indicators
Key resistance levels - $0.80 and $1.00
Key support levels - $0.40 and $0.20
What is the next move for Ripple?
Over the past week, Ripple has been in a sideways movement. It is currently moving back and forth between the moving average lines. XRP is slipping and retesting the 21-day line SMA as support. The range movement will continue if the current support holds. However, if the current support fails, the altcoin will drop to a level of $0.31 or $0.19.

Disclaimer. This analysis and forecast are the personal opinions of the author and are not a recommendation to buy or sell cryptocurrency and should not be viewed as an endorsement by CoinIdol. Readers should do their own research before investing
OhNoCryptocurrency via https://www.ohnocrypto.com/ @coinidol.com By Coin Idol, @Khareem Sudlow
