Weekly Cryptocurrency Market Analysis: Altcoins Move In A Range As Traders Become Uncertain
Dec 29, 2022 at 14:30 //
PriceThis week, cryptocurrencies fall into two categories. As traders remained uncertain about the direction of the market, a certain group of altcoins is bound in a range. Another group of cryptocurrencies has seen a significant decline and bearish exhaustion.
The market is still in a bear market. Let us take a closer look at each of these cryptocurrencies.
Quant
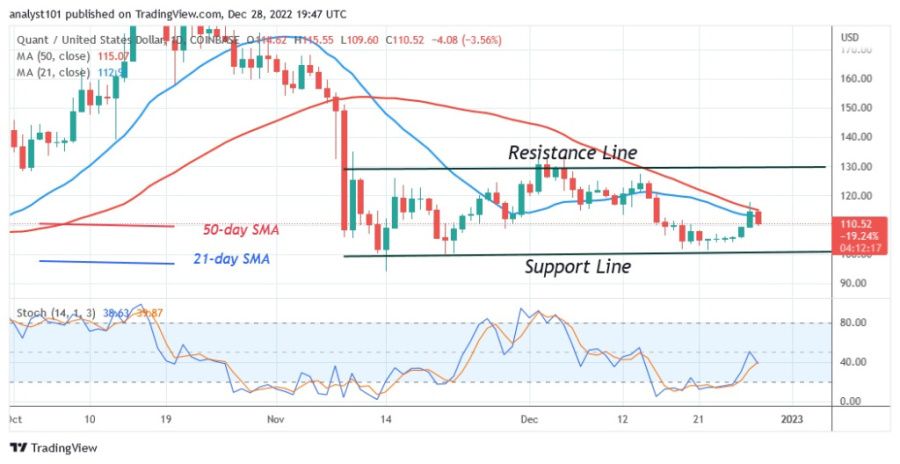
The price of Quant (QNT) is moving sideways under the moving average lines. The cryptocurrency's price has been fluctuating between $100 and $130 since November 9, and buyers' attempts to keep the price above the moving average lines yesterday were unsuccessful. Having failed to break the moving average lines, the altcoin is now declining. Since December 15, the moving averages line has stopped any upward movement. The altcoin will fall and either retest the lower price range or break below it. QNT has the same chance to regain its previous highs. Quant is above the 40 level of daily stochastics and is in a bullish momentum. These characteristics make it the best performing cryptocurrency this week.
Current price: $111.53
Market capitalization: $1,629,391,502
Trading volume: $31,457,511
7-Day gain/loss: 7.58%
Internet Computers
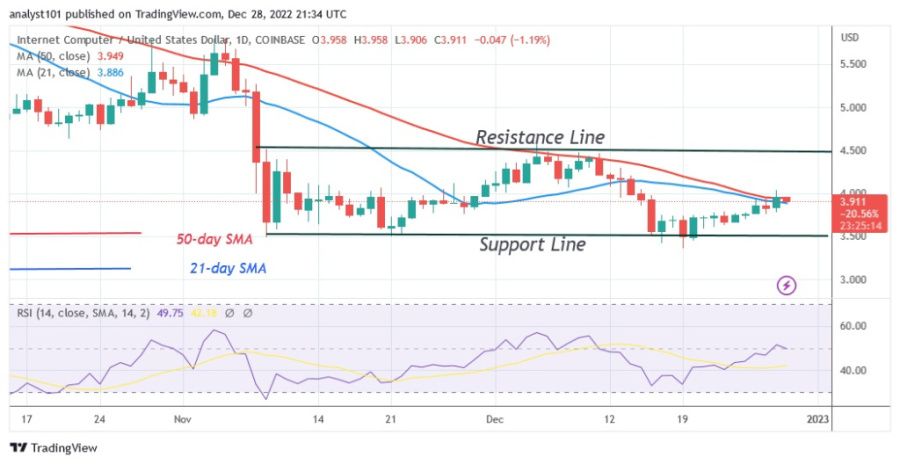
Internet Computers (ICP) price is moving sideways while in the bearish trend zone. The moving average lines are rejecting the upward correction. If the buyers fail to keep the price above the moving average lines, ICP will fall. If the buyers are successful, ICP will rise above the moving average lines and retest the overriding $4.50 resistance level. Internet Computer's price is currently hovering between $3.50 and $4.50, with price bars between the moving average lines, suggesting that the cryptocurrency may be moving in a range. The altcoin is at level 51 for period 14 of the Relative Strength Index. This indicates that the forces of supply and demand are in balance. It shows that the Altcoin, the second best cryptocurrency, has the following characteristics:
Current price: $3.96
Market capitalization: $1,942,147,607
Trading volume: $34,628,788
Casper
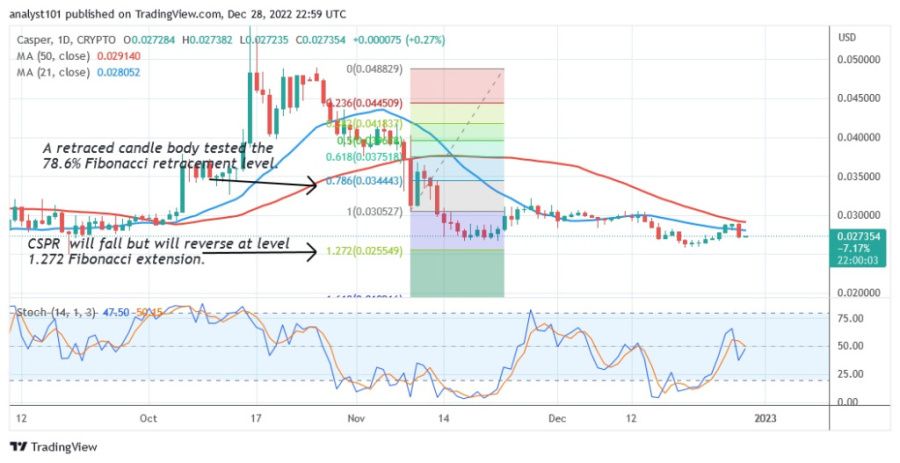
Casper (CSPR) is in decline and has made a significant downward move. From its high of $0.58 to its low of $0.027, the stock has declined. However, as the market approaches oversold territory, the selling pressure has eased. The altcoin is currently in a downtrend after encountering resistance at $0.03. The altcoin recovered from the November 9 downtrend and a candlestick tested the 78.6% Fibonacci retracement level. After the correction, CSPR will fall but reverse at the 1.272 Fibonacci extension level or $0.025. Below the daily stochastic level of 50, the altcoin experiences bearish momentum. The following characteristics describe Casper, which is currently the third best performing cryptocurrency:
Current price: of $0.02728
Market capitalization: $311,959,339
Trading volume: $3,601,312
7-Day gain/loss: 5.83%
XRP
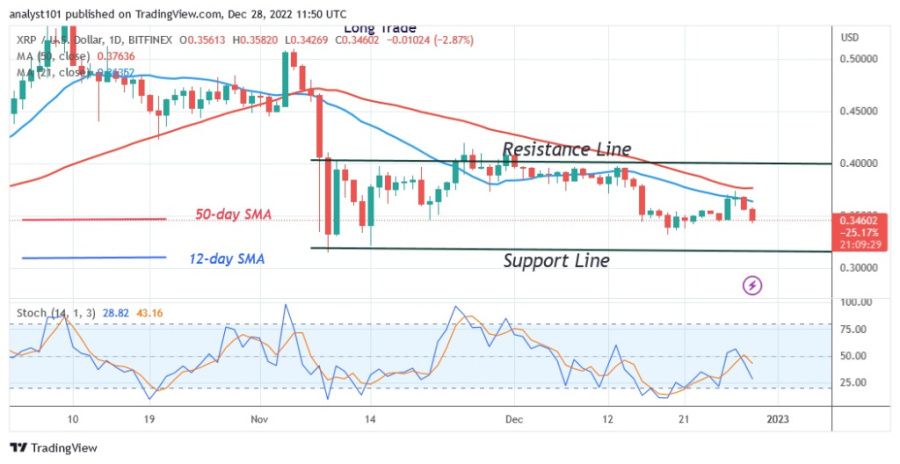
Ripple (XRP) is falling as a result of the rejection at the moving average lines. While XRP continues to fall towards the current support, the moving average lines have halted the upside. Buyers previously failed to keep the price above the moving average lines on December 27. The cryptocurrency will rise above the moving average lines and retest the $0.40 resistance level if the buyers are successful. XRP is currently in a downtrend and will soon return to its previous lows of $0.34 or $0.31. Below the daily stochastic level of 50, the altcoin is experiencing bearish momentum. This week, it is the fourth best performing cryptocurrency. It has these characteristics:
Current price: $0.3465
Market capitalization: $34.653.787.180
Trading volume: $907,393,093
7-day gain/loss: 4.24%
IOTA
The price of IOTA (MIOTA) has dropped significantly to the bottom of the chart. The value of the cryptocurrency asset has fallen since its peak of $2.68 and is now worth only $0.16. It is currently circling above the $0.15 support. The moving average lines have put the brakes on the upside. The Relative Strength Index for the period 14 altcoin is at level 29. MIOTA has reached the part of the market that is oversold. This indicates that selling pressure has reached bearish exhaustion. It is unlikely that the downside selling will continue. The fifth best performing cryptocurrency is MIOTA. It has these characteristics:
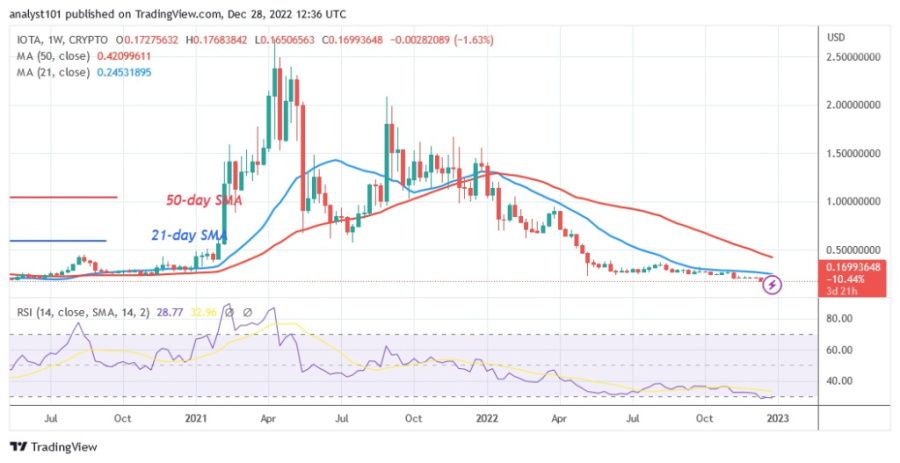
Current price: $0.1698
Market capitalization: $472,029,875
Trading volume: $8,007,187
7–day gain/loss: 22.34%
Disclaimer. This analysis and forecast are the personal opinions of the author and are not a recommendation to buy or sell cryptocurrency and should not be viewed as an endorsement by CoinIdol. Readers should do their research before investing in funds.
OhNoCryptocurrency via https://www.ohnocrypto.com/ @coinidol.com By Coin Idol, @Khareem Sudlow
